
Gordon Head Real Estate Market Update 2026 | Victoria BC
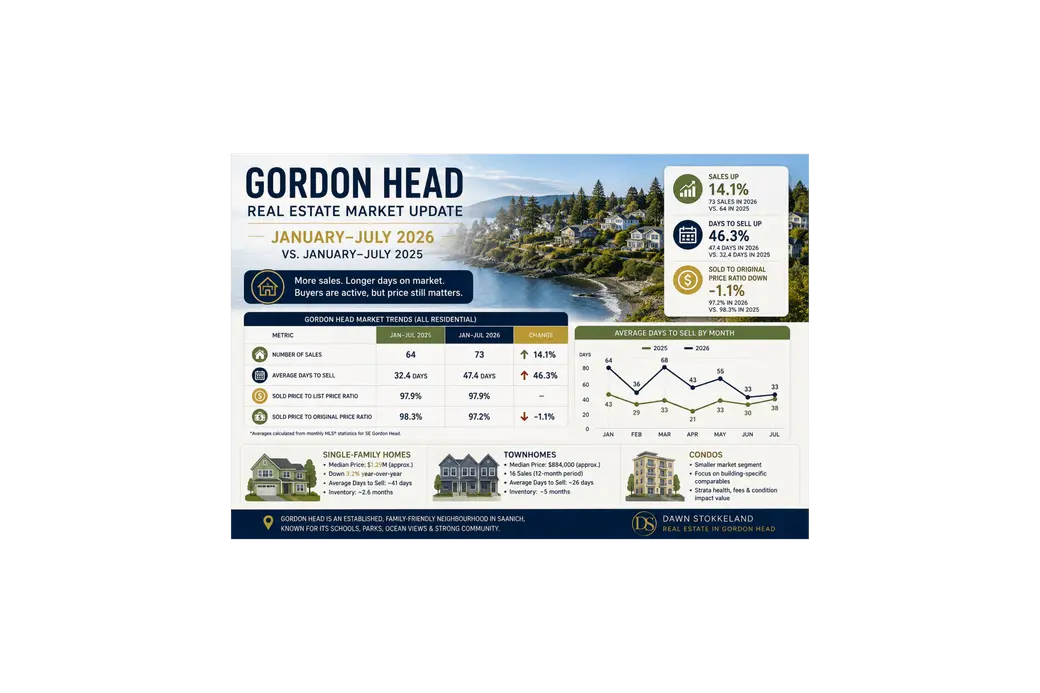
Gordon Head Real Estate Market: January–July 2026 vs. 2025
What is really happening in the Gordon Head real estate market in 2026?
Rather than looking only at Greater Victoria statistics, I compared MLS® sales activity specifically within SE Gordon Head, Saanich East, from January through July 2026 with the same seven-month period in 2025.
The numbers reveal an interesting market. More properties sold in Gordon Head in 2026, but buyers became more price-conscious and homes generally took longer to sell.
Gordon Head Real Estate: 2025 vs. 2026 at a Glance
From January through July 2025, 64 properties sold in SE Gordon Head.
During the same period in 2026, that increased to 73 sales.
That represents an approximate 14.1% increase in the number of properties sold year-over-year.
| Gordon Head Market Indicator | Jan–Jul 2025 | Jan–Jul 2026 | Change |
|---|---|---|---|
| Number of sales | 64 | 73 | +14.1% |
| Avg. monthly days to sell* | 32.4 days | 47.4 days | +46.3% |
| Avg. sold-to-original-price ratio* | 98.3% | 97.2% | -1.1 percentage points |
*The days-to-sell and price-ratio figures above are simple averages of the seven monthly MLS® figures and are intended to illustrate the overall trend rather than a transaction-weighted annual average.
The takeaway is important: Gordon Head had more sales in 2026, but that doesn't mean it became a hotter seller's market.
Buyers remained active, but they were also more selective.
Gordon Head Sales Increased 14% in 2026
The increase in transactions is one of the strongest pieces of the 2026 story.
There were 64 sales between January and July 2025 compared with 73 during the same period in 2026.
That's approximately nine additional sales, or a 14.1% year-over-year increase.
For homeowners, this is encouraging because it demonstrates that buyers haven't disappeared from the Gordon Head market.
There is demand.
But the rest of the statistics show that attracting a buyer and achieving the seller's original price are two different things.
Homes Took Longer to Sell in 2026
This is where the comparison gets particularly interesting.
Average days to sell by month in 2025 were:
- January: 43 days
- February: 29 days
- March: 33 days
- April: 21 days
- May: 33 days
- June: 30 days
- July: 38 days
The simple monthly average was approximately 32 days.
Compare that with 2026:
- January: 64 days
- February: 36 days
- March: 68 days
- April: 43 days
- May: 55 days
- June: 33 days
- July: 33 days
The simple monthly average increased to approximately 47 days.
That's roughly a 46% increase in average monthly market time.
This is one of the clearest signs that the 2026 Gordon Head market has become more price-sensitive.
But There's Good News in the Summer Numbers
The year-to-date comparison doesn't tell the entire story.
Although homes generally took longer to sell in 2026, market time improved substantially as summer approached.
March 2026 saw properties averaging 68 days to sell. By June and July, that had fallen to just 33 days.
Interestingly, that's very close to June 2025's 30 days and actually faster than July 2025's 38 days.
So I wouldn't characterize Gordon Head as simply a slowing market.
A better description is a market that started 2026 slowly but gained momentum heading into summer.
Sellers Are Accepting More Negotiation From Their Original Price
The relationship between original asking price and eventual sale price is particularly useful when evaluating seller expectations.
In 2025, the monthly sold-price-to-original-price ratios were:
| Month | 2025 | 2026 |
| January | 97.1% | 95.0% |
| February | 99.1% | 100.0% |
| March | 98.1% | 96.9% |
| April | 98.2% | 96.4% |
| May | 100.0% | 98.3% |
| June | 96.4% | 97.4% |
| July | 99.0% | 96.3% |
The simple monthly average declined from approximately 98.3% in 2025 to 97.2% in 2026.
That's a decline of roughly 1.1 percentage points.
It may not sound significant, but on a $1.3-million property, one percentage point represents approximately $13,000.
This is why the original asking price matters.
Final List Price vs. Original List Price
There's another useful clue in the 2026 data.
Gordon Head properties sold for between 96.1% and 100% of their final list price during the first seven months of 2026.
The monthly figures were:
January 96.1%, February 100%, March 98.6%, April 97.2%, May 98.3%, June 98.1% and July 96.8%.
The simple monthly average was approximately 97.9% of final list price.
Compare that with approximately 97.2% of original asking price.
Why the difference?
Because the final list price isn't necessarily the price at which the property originally entered the market.
Some sellers may reduce their asking price before eventually receiving an acceptable offer.
For sellers, that's a valuable lesson: pricing a home too high at the beginning doesn't necessarily result in a higher sale price.
It may simply result in more time on the market followed by a price adjustment.
What Happened to Prices in Gordon Head?
This requires a little more caution.
In 2025, the total dollar volume of the 64 reported sales from January through July was approximately $84.15 million.
Dividing that sales volume by the 64 transactions produces an approximate average transaction value of $1.315 millionfor that period.
However, I would not use that number alone to claim Gordon Head property values increased or decreased by a particular percentage.
Why?
Because Gordon Head contains very different types of real estate.
A condominium might sell for hundreds of thousands of dollars, while a waterfront Gordon Head property can sell for several million.
A few high-value detached sales can therefore move the neighbourhood average substantially.
This is exactly why we need to look at property types separately.
Single-Family Homes in Gordon Head
Single-family homes make up the largest and most important segment of the Gordon Head housing market.
Detached properties can range from older homes requiring substantial renovation to beautifully updated family homes and high-end waterfront properties.
That diversity makes a neighbourhood-wide average particularly dangerous when determining the value of a specific house.
The broader 2026 Gordon Head data tells us buyers are active—overall residential transactions increased 14.1% year-over-year—but buyers are also demonstrating greater sensitivity to price.
For detached-home sellers, this means recent comparable sales should carry considerably more weight than what neighbouring homeowners are currently asking.
A well-prepared, properly priced detached home can still attract strong interest. An overpriced property may instead accumulate days on market before requiring a price adjustment.
Townhomes in Gordon Head
Townhomes represent a much smaller portion of Gordon Head's housing stock.
Because fewer townhomes sell, averages and percentage changes can be distorted by only a handful of transactions.
Townhome buyers are also making a different purchasing decision than detached-home buyers. Strata fees, age, condition, outdoor space, parking and strata finances can all influence value.
For that reason, a Gordon Head townhouse should ideally be compared with recent sales within the same development or genuinely comparable nearby complexes, rather than with Gordon Head residential prices overall.
Condos in Gordon Head
Condominiums make up another relatively small portion of the Gordon Head market.
As with townhouses, a neighbourhood-wide average provides limited guidance for an individual condo.
Building age, unit size, floor level, exposure, renovations, parking, storage, strata fees, depreciation reports and the financial health of the strata can all have a substantial effect on value.
When assessing a Gordon Head condo, sales within the same building are often far more useful than the overall neighbourhood average.
What Does the 2026 Gordon Head Market Mean for Sellers?
There are three numbers I think Gordon Head sellers should pay particular attention to:
Sales increased 14.1%.
There are buyers in the market.
Properties generally took longer to sell.
The simple monthly average increased from approximately 32 days in 2025 to 47 days in 2026.
Sellers received slightly less relative to their original asking price.
The simple monthly average moved from approximately 98.3% to 97.2%.
Put those three together and the message becomes fairly clear.
Demand exists, but buyers aren't chasing every listing.
They have become more selective about both the property and the price.
What Does the Market Mean for Gordon Head Buyers?
Buyers shouldn't interpret longer market times as meaning every seller is prepared to accept a dramatically lower offer.
In fact, properties still averaged approximately 97.9% of their final asking prices across the monthly 2026 figures.
That suggests correctly priced properties are still selling relatively close to asking.
The opportunity for buyers is more likely to appear when a property has been sitting on the market, has already undergone a price reduction or is clearly priced above comparable recent sales.
Is Gordon Head a Buyer's or Seller's Market in 2026?
The data doesn't support an overly simple answer.
Sales activity increased, which is positive for sellers.
Market time increased, which gives buyers more breathing room.
And the decline in the sold-to-original-price ratio suggests sellers are having to be somewhat more realistic about pricing.
I'd describe the first seven months of 2026 as an active but price-sensitive Gordon Head market.
Good properties can sell.
But pricing strategy matters considerably more than it does during a rapidly appreciating seller's market.
The Bottom Line: Gordon Head Real Estate in 2025 vs. 2026
The first seven months of 2026 produced more Gordon Head sales than the same period in 2025, with transactions increasing from 64 to 73—approximately 14.1%.
At the same time, properties generally took longer to sell and sellers received slightly less relative to their original asking prices.
The market also showed signs of strengthening heading into summer, with average selling time dropping to 33 days in both June and July 2026.
For homeowners, the message isn't that the Gordon Head market is weak.
It's that buyers have become more discerning.
And that's why determining the value of a Gordon Head property requires more than looking at a neighbourhood average.
The real question is:
What are homes like yours actually selling for in Gordon Head today?
Data based on MLS® statistics for the SE Gordon Head sub-area of Saanich East for January 1 through July 31, 2025 and the corresponding period in 2026. Because Gordon Head has a relatively small number of transactions and a diverse mix of property types, monthly averages can fluctuate and should be interpreted in conjunction with property-specific comparable sales.
Categories
Recent Posts









REVIEWS